Australia 200 Index – getting close to psychological price line
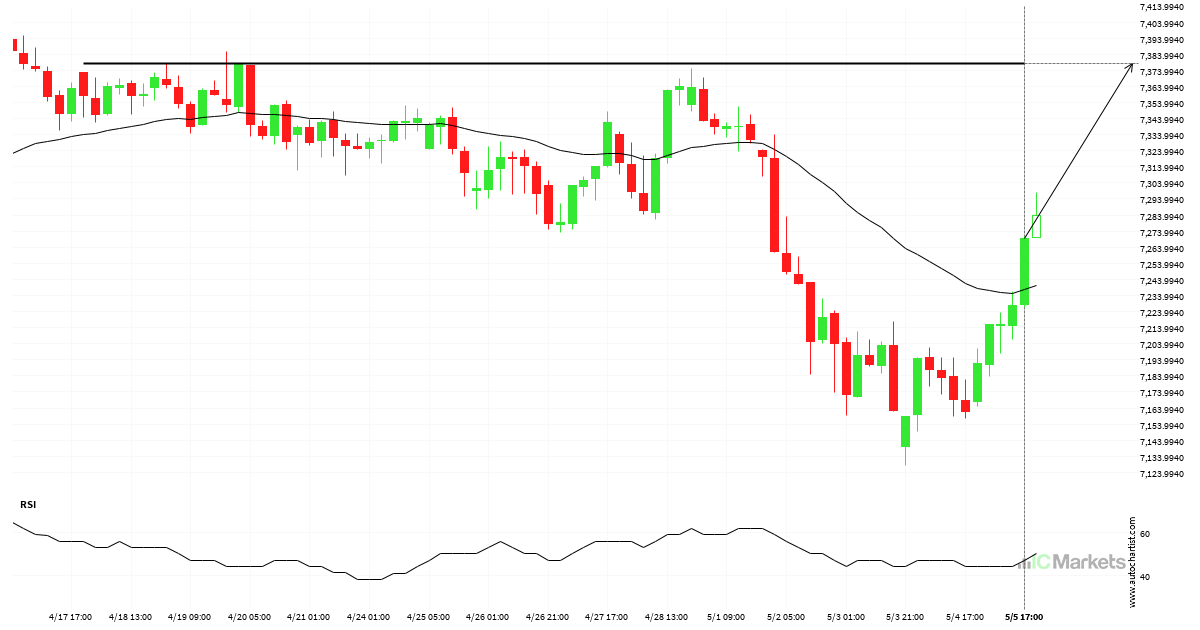
Australia 200 Index is moving towards a resistance line. Because we have seen it retrace from this level in the past, we could see either a break through this line, or a rebound back to current levels. It has touched this line numerous times in the last 18 days and may test it again within […]
Hong Kong 50 Index has broken through resistance
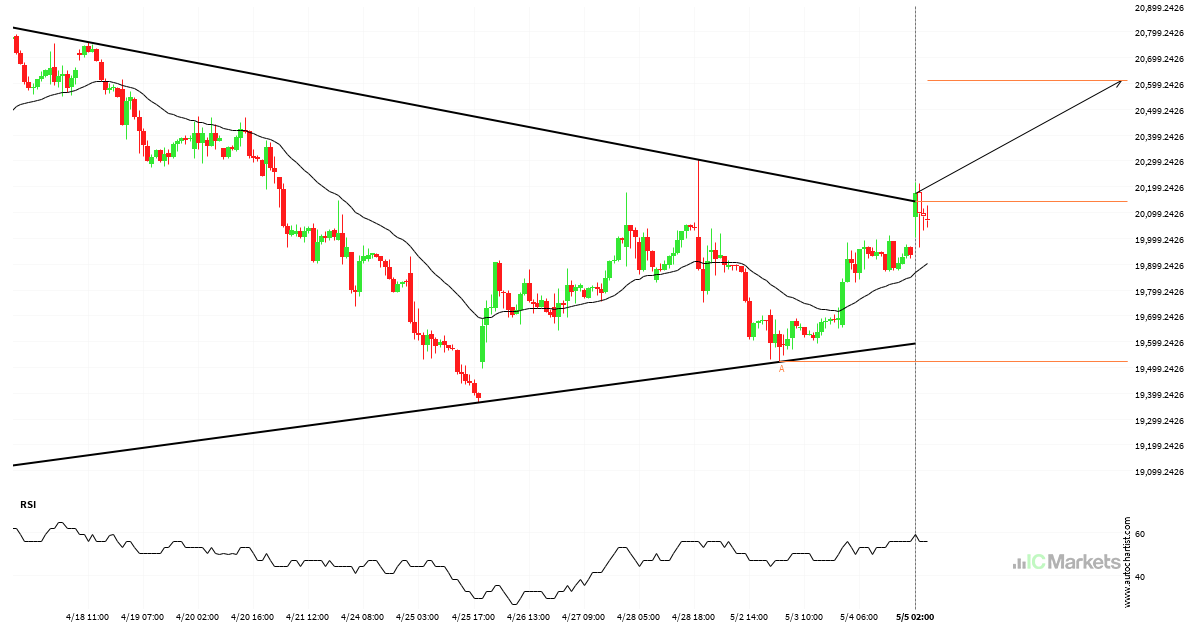
Hong Kong 50 Index has broken through a resistance line. It has touched this line at least twice in the last 23 days. This breakout may indicate a potential move to 20609.1048 within the next 3 days. Because we have seen it retrace from this position in the past, one should wait for confirmation of […]
Hong Kong 50 Index approaching support of a Channel Down
Hong Kong 50 Index is approaching the support line of a Channel Down. It has touched this line numerous times in the last 22 days. If it tests this line again, it should do so in the next 3 days.
FTSE China A50 Index – getting close to psychological price line
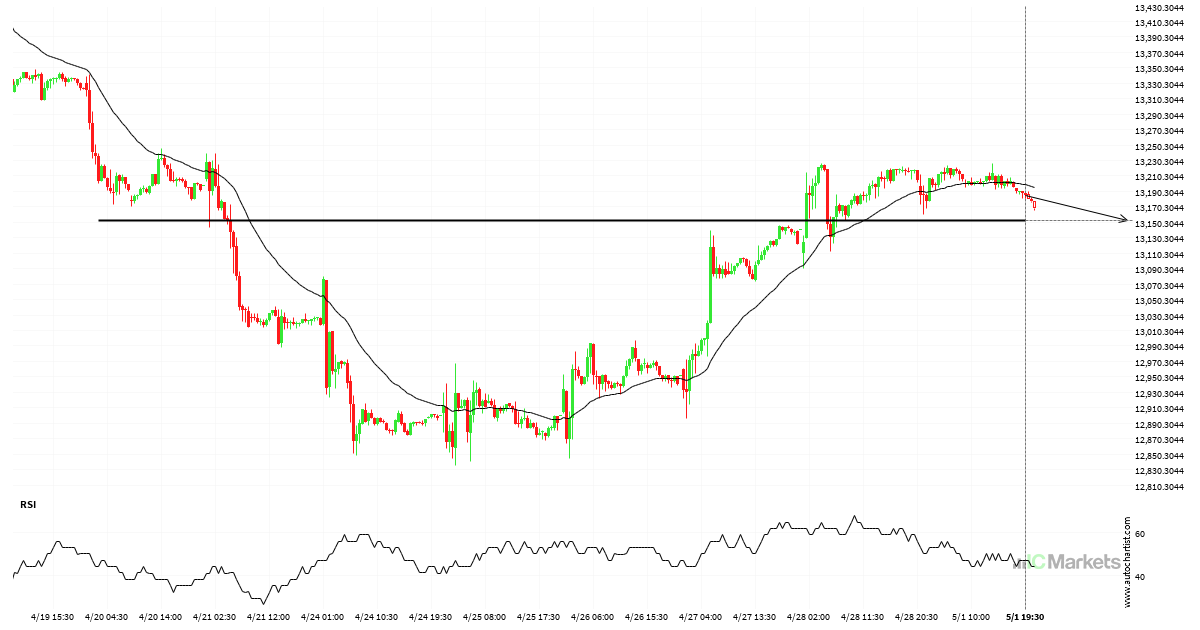
FTSE China A50 Index is moving towards a support line. Because we have seen it retrace from this level in the past, we could see either a break through this line, or a rebound back to current levels. It has touched this line numerous times in the last 12 days and may test it again […]
Hong Kong 50 Index approaching resistance of a Channel Up
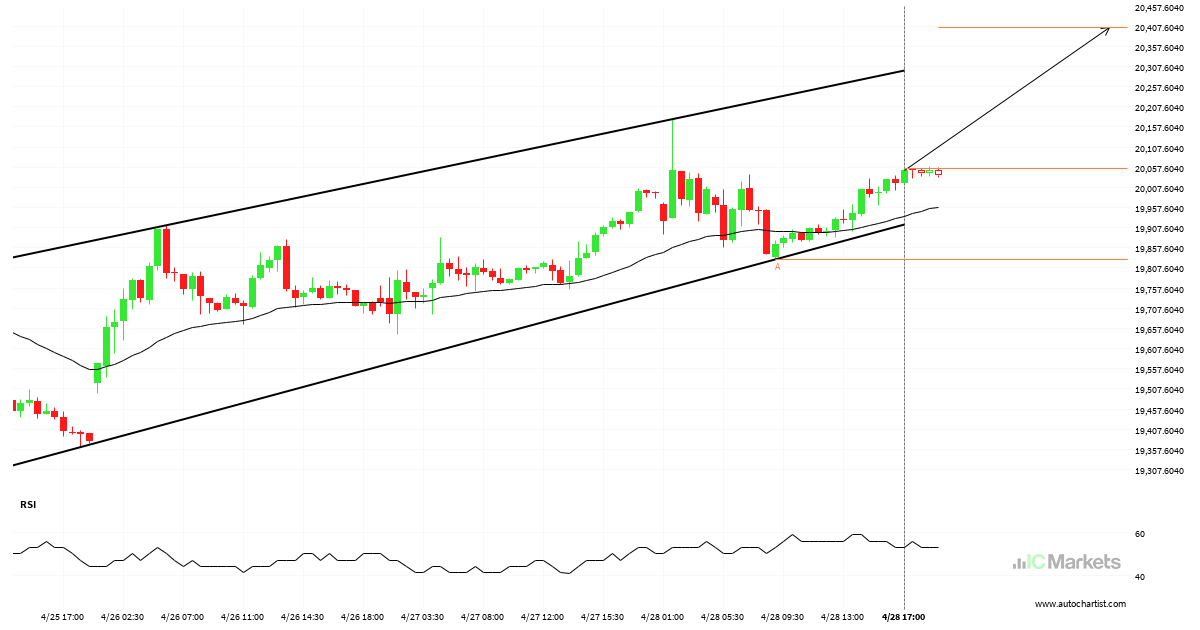
Hong Kong 50 Index is approaching the resistance line of a Channel Up. It has touched this line numerous times in the last 9 days. If it tests this line again, it should do so in the next 13 hours.
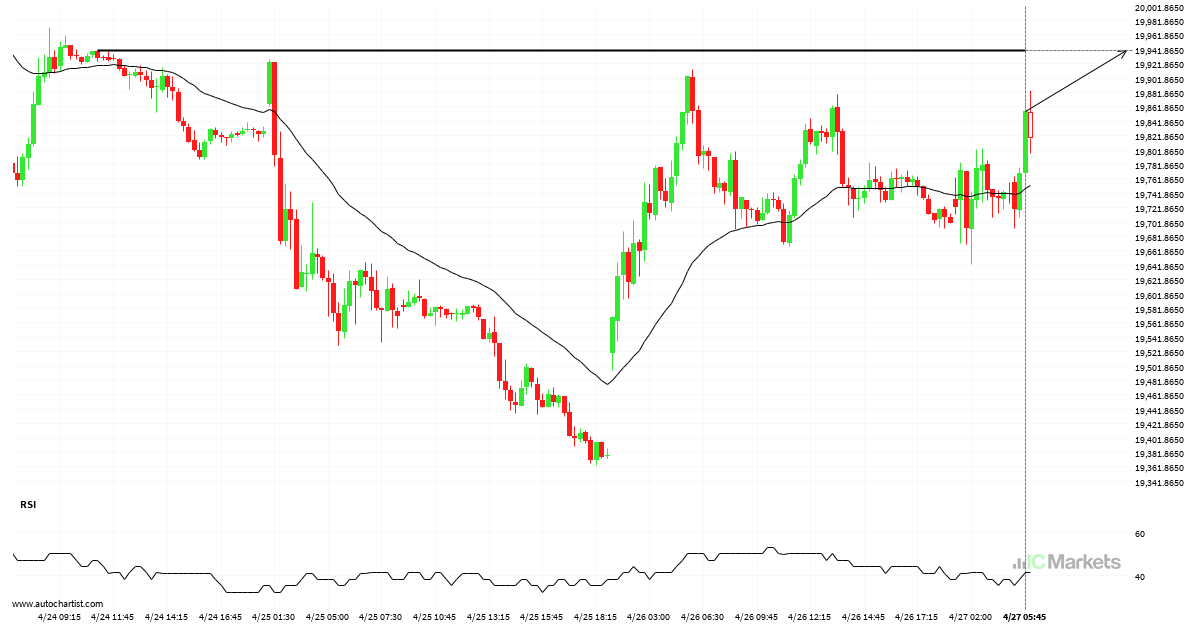
Hong Kong 50 Index – getting close to psychological price line
Hong Kong 50 Index is moving towards a resistance line. Because we have seen it retrace from this level in the past, we could see either a break through this line, or a rebound back to current levels. It has touched this line numerous times in the last 3 days and may test it again […]
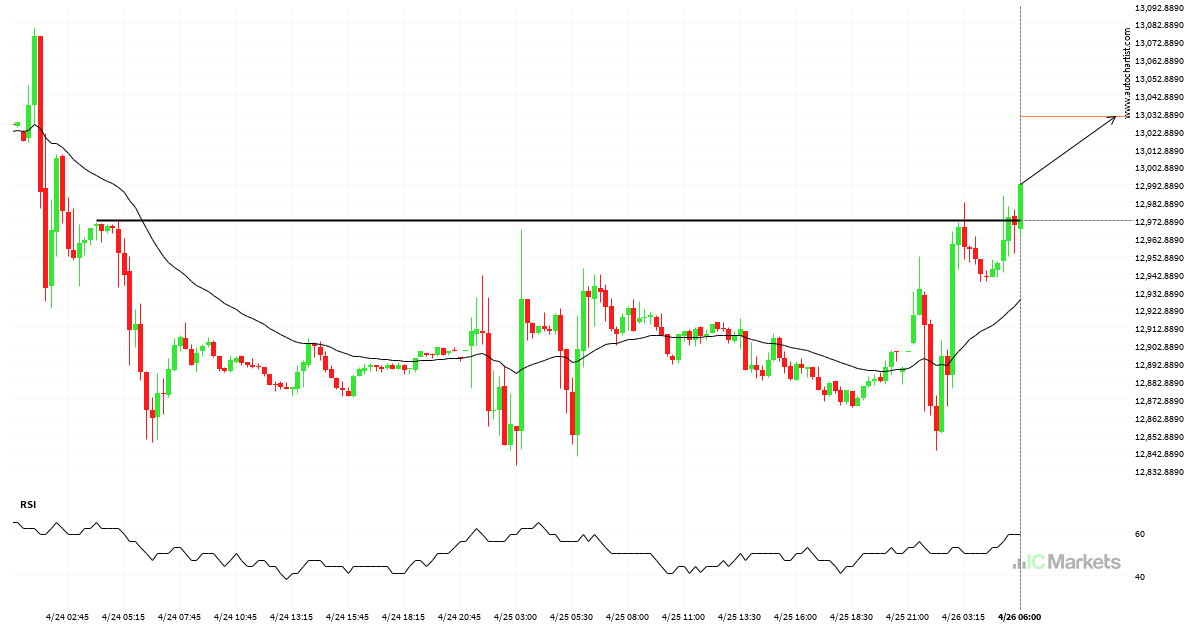
FTSE China A50 Index broke through important 12972.6602 price line
FTSE China A50 Index has broken through a resistance line. It has touched this line numerous times in the last 3 days. This breakout shows a potential move to 13031.1943 within the next 10 hours. Because we have seen it retrace from this level in the past, one should wait for confirmation of the breakout.
5 consecutive daily bearish candles on Hong Kong 50 Index
Hong Kong 50 Index has moved lower after 5 consecutive daily candles from 20628.6000 to 19823.5000 in the last 8 days.
5 consecutive daily bearish candles on Australia 200 Index
Australia 200 Index has moved lower after 5 consecutive daily candles from 7393.4000 to 7327.5600 in the last 6 days.
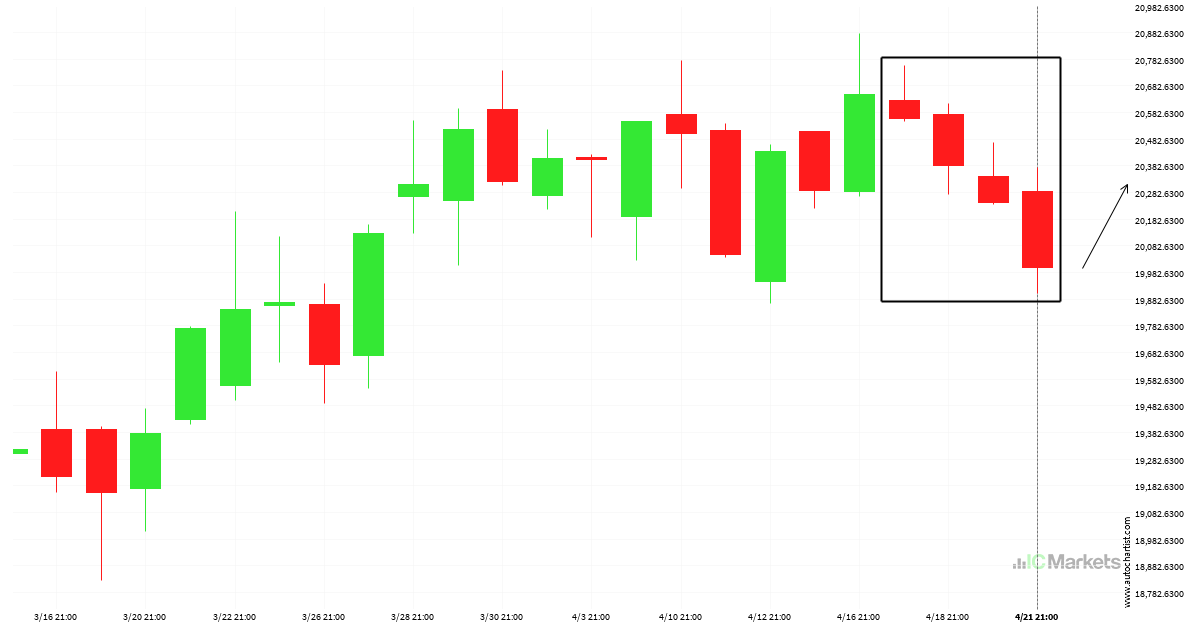
4 consecutive daily bearish candles on Hong Kong 50 Index
Hong Kong 50 Index has moved lower after 4 consecutive daily candles from 20628.6000 to 19999.8000 in the last 5 days.

